Unlocking Native Observability in MuleSoft with OpenTelemetry, Grafana Cloud, and CloudHub 2.0
The Observability Challenge in Integration Platforms
Modern enterprises run complex integration landscapes: APIs, microservices, event-driven flows, and cloud deployments all talking to each other. When something goes wrong, the first question is always: where did it break, and why?
Traditional logging gives you breadcrumbs. But true observability means being able to answer three questions at any point in time:
- What happened? (Logs)
- How long did it take? (Traces)
- How is the system behaving? (Metrics)
For MuleSoft users, this used to require external tools, log shippers, sidecar containers, and custom instrumentation. With Mule 4.11, that changes. And with Grafana Cloud as the backend, you get a production-grade observability stack without managing any infrastructure.
What is OpenTelemetry?
OpenTelemetry (OTel) is an open-source observability framework that the Cloud Native Computing Foundation (CNCF) backs. It gives organizations a standardized way to collect, process, and export telemetry data, including logs, traces, and metrics, from any application, regardless of the backend they use.
Think of it as a universal language for observability. Whether your backend is Grafana, Datadog, New Relic, or Splunk, OTel speaks to all of them the same way.
The three pillars of OTel:
| Pillar | What it tells you | OTel signal |
| Logs | What happened in the system | Log records with severity, body, attributes |
| Traces | How a request traveled through the system | Spans with Trace ID, Parent ID, duration |
| Metrics | How the system is performing over time | Counters, gauges, histograms |
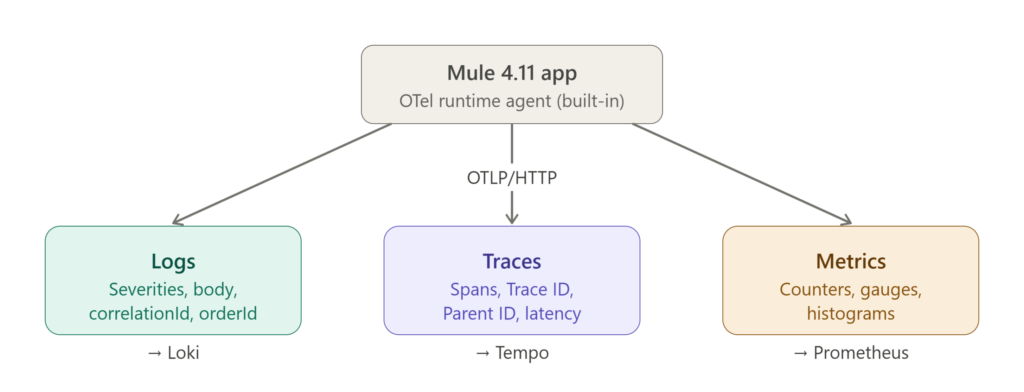
Mule 4.11 Native OTel Support
Before Mule 4.11, retrieving logs and traces from a Mule application required external agents such as Fluent Bit, log4j appenders, or custom HTTP connectors. These worked, but added infrastructure complexity and maintenance overhead.
From Mule 4.11 onwards, the runtime ships with built-in OpenTelemetry support. This means:
- No external agents: Mule pushes telemetry directly via OTLP (OTel Protocol)
- No code changes: Observability is enabled via deployment properties at deploy time
- Production-ready: Works on local, CloudHub 2.0, and Runtime Fabric (RTF)
POC Architecture CloudHub 2.0 + Grafana Cloud
For this POC, we deployed a Mule 4.11.4 EE observability solution pack to CloudHub 2.0 and shipped telemetry directly to Grafana Cloud over OTLP/HTTP. No OTel Collector, no sidecar, no infrastructure to manage just the Mule app and Grafana Cloud.
The pipeline is:
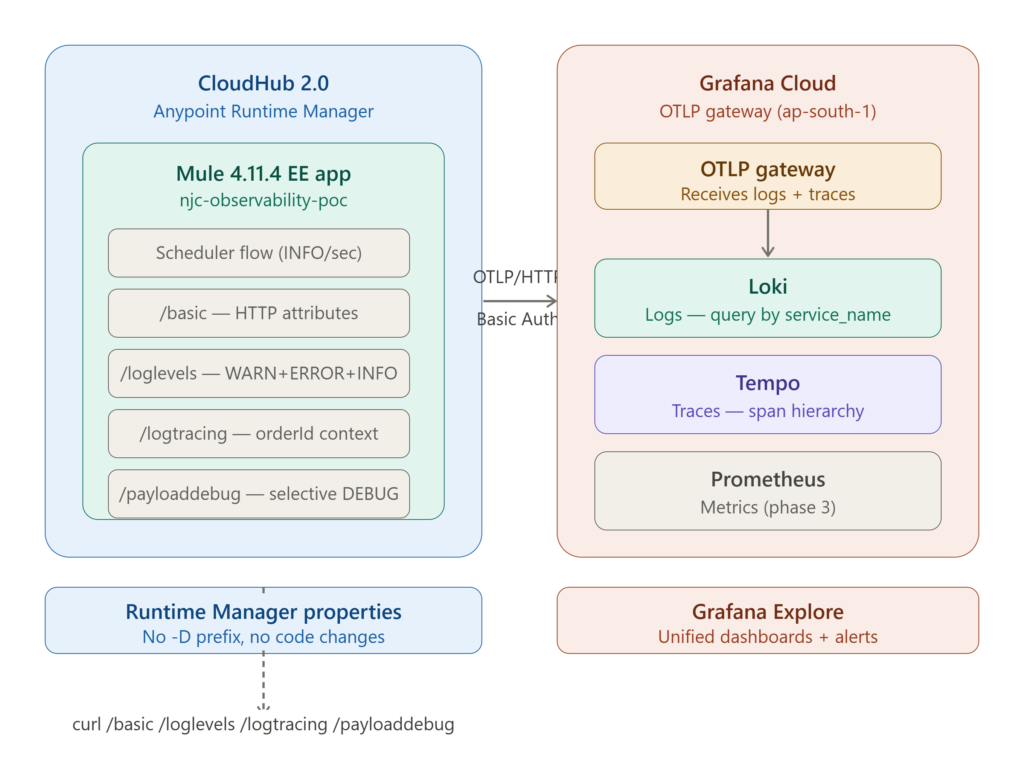
Grafana Cloud automatically routes incoming OTLP traffic to the right backend: logs go to Loki, traces go to Tempo, and both are queryable from a single Grafana Explore interface.
Step 1: Get Your Grafana Cloud OTLP Endpoint and Token
In Grafana Cloud, go to Connections → OpenTelemetry. You will find:
- Your OTLP endpoint (e.g.
https://otlp-gateway-prod-ap-south-1.grafana.net/otlp) - An Instance ID and API token for authentication
The token is used as HTTP Basic Auth on the OTLP endpoint. Grafana provides it pre-encoded as a Base64 string keep it safe and never commit it to source control.
Step 2: Configure Deployment Properties in CloudHub 2.0
In CloudHub 2.0, OTel is enabled by passing properties in Anypoint Runtime Manager → your app → Properties tab. No -D prefix is needed; Runtime Manager handles the JVM argument injection internally.
| Property | Value |
mule.openTelemetry.tracer.exporter.enabled | true |
mule.openTelemetry.logging.exporter.enabled | true |
mule.openTelemetry.tracer.exporter.type | HTTP |
mule.openTelemetry.logging.exporter.type | HTTP |
mule.openTelemetry.tracer.exporter.endpoint | https://otlp-gateway-prod-ap-south-1.grafana.net/otlp/v1/traces |
mule.openTelemetry.logging.exporter.endpoint | https://otlp-gateway-prod-ap-south-1.grafana.net/otlp/v1/logs |
mule.openTelemetry.tracer.exporter.headers | Authorization=Basic <your-base64-token> |
mule.openTelemetry.logging.exporter.headers | Authorization=Basic <your-base64-token> |
mule.openTelemetry.exporter.resource.service.name | njc-observability-poc |
log.level.com.acme.order.create.service.debug | DEBUG |
mule.openTelemetry.logging.exporter.level | DEBUG |
Two important points here. First, the endpoint URL must include the full path /v1/traces for traces and /v1/logs for logs. Second, the Authorization header uses a literal space between Basic and the token, not URL-encoded %20.
Once deployed, Mule starts pushing telemetry to Grafana Cloud automatically. No application restart or code change is needed when you update these properties.
Step 3: Verify in Grafana Cloud
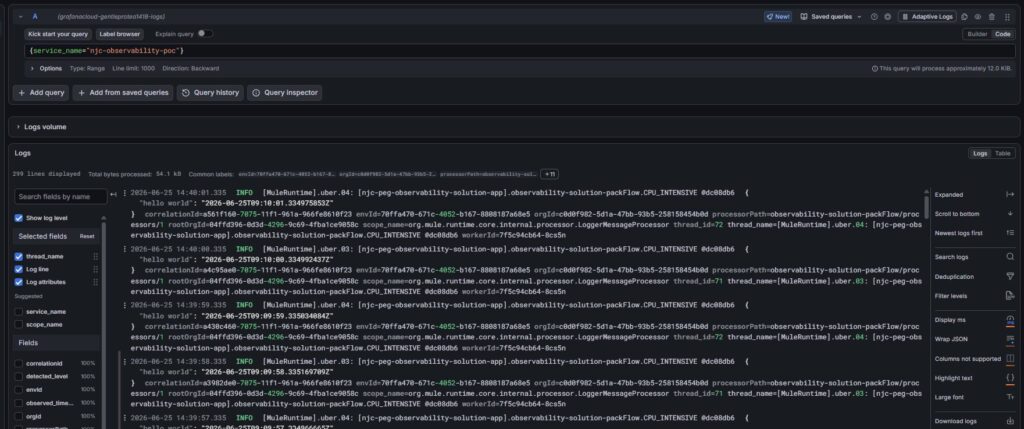
Once the app is deployed and running, open Grafana Cloud → Explore and select the Loki datasource (named grafanacloud-<your-stack>-logs).
Query all logs for the service:
{service_name="njc-observability-poc"}Set the time range to Last 5 minutes and hit Run query. If logs are flowing, you will see entries within seconds of the app starting. The Scheduler flow fires an INFO log every second, so it is the fastest way to confirm the pipeline is working.
Key OTel Concepts in Mule Context
1. Log Records
Every Logger component in a Mule flow generates an OTel log record with:
SeverityText: INFO, WARN, ERROR, DEBUG, TRACEBody: the log message contentcorrelationId: Mule’s event correlation ID linking logs to a specific executionprocessorPath: exact location in the flow (e.g.observability-solution-pack-basic/processors/0)service.name: the application name set via deployment propertyservice.namespace: the runtime namespace (mule)
2. Selective DEBUG Logging
A key production pattern demonstrated in this POC is selective DEBUG logging, enabling DEBUG only for a specific logger category without flooding the entire application with debug output.
This is done by setting two properties at deploy time:
log.level.com.acme.order.create.service.debug = DEBUG
mule.openTelemetry.logging.exporter.level = DEBUG
Combined with a logger configured with that specific category:
<logger level="DEBUG"
category="com.acme.order.create.service.debug"
message="#[payload]" />
This allows teams to turn on detailed debugging for a specific service or flow in production without impacting other flows and without redeploying the application.
3. Spans and Traces
Every flow execution generates a distributed trace with a hierarchy of spans. Each span carries:
Trace ID: unique identifier shared across the entire requestSpan ID: unique identifier for this specific operationParent ID: links child spans back to their parentStart timeandEnd time: for latency measurementartifact.id: the Mule application namecorrelation.id: links back to the Mule event
4. Trace Variables – Business Context Propagation
One of the most powerful OTel features in Mule 4.11 is the ability to attach custom business context to traces using the mule-tracing-module. The set-logging-variable component propagates a variable as an attribute across all downstream log records and spans in the same flow execution:
<tracing:set-logging-variable
variableName="orderId"
value="12345789" />
This means every log record and span generated after this component will carry orderId=12345789 making it trivial to search and filter by business identifiers directly in Grafana Loki.
HTTP Endpoint Telemetry – What We Tested
The POC exposes four HTTP endpoints deployed on CloudHub 2.0, each demonstrating a different observability scenario:
| Endpoint | Flow | What it demonstrates |
| Scheduler | observability-solution-packFlow | Continuous INFO logs every second |
| /basic | observability-solution-pack-basic | Simple INFO log with full HTTP request attributes |
| /loglevels | observability-solution-pack-log-levels | WARN + ERROR + INFO in a single flow execution |
| /logtracing | observability-solution-pack-log-levels1 | All log levels + orderId business context |
| /payloaddebugloggers | observability-solution-pack-selective-payload-logging | Selective DEBUG with category filter |
To hit the endpoints from command line:
curl https://njc-peg-observability-solution-app-g4f43h.rajrd4-2.usa-e1.cloudhub.io/basic
curl https://njc-peg-observability-solution-app-g4f43h.rajrd4-2.usa-e1.cloudhub.io/loglevels
curl https://njc-peg-observability-solution-app-g4f43h.rajrd4-2.usa-e1.cloudhub.io/logtracing
curl https://njc-peg-observability-solution-app-g4f43h.rajrd4-2.usa-e1.cloudhub.io/payloaddebugloggers
Viewing Logs in Grafana Cloud Loki
After hitting the endpoints, go to Grafana → Explore → Loki and query:
{service_name="njc-observability-poc"}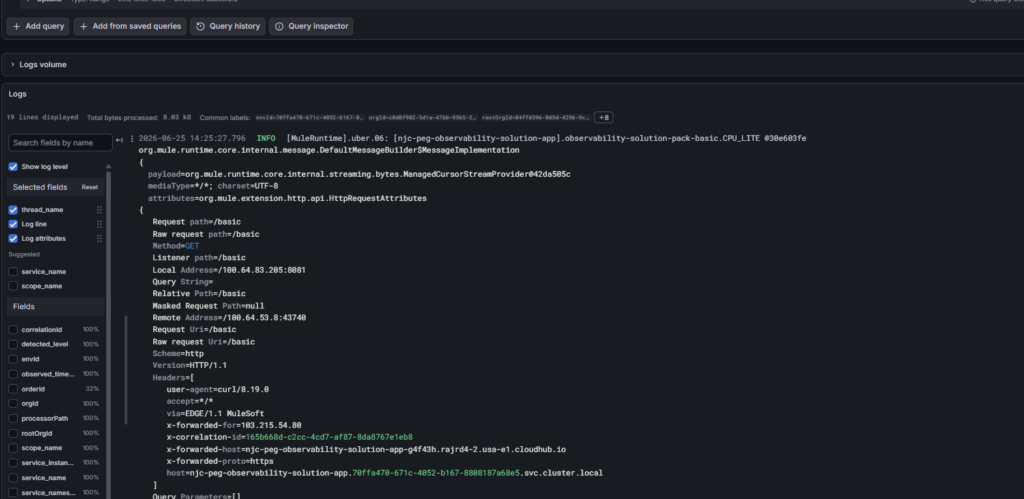
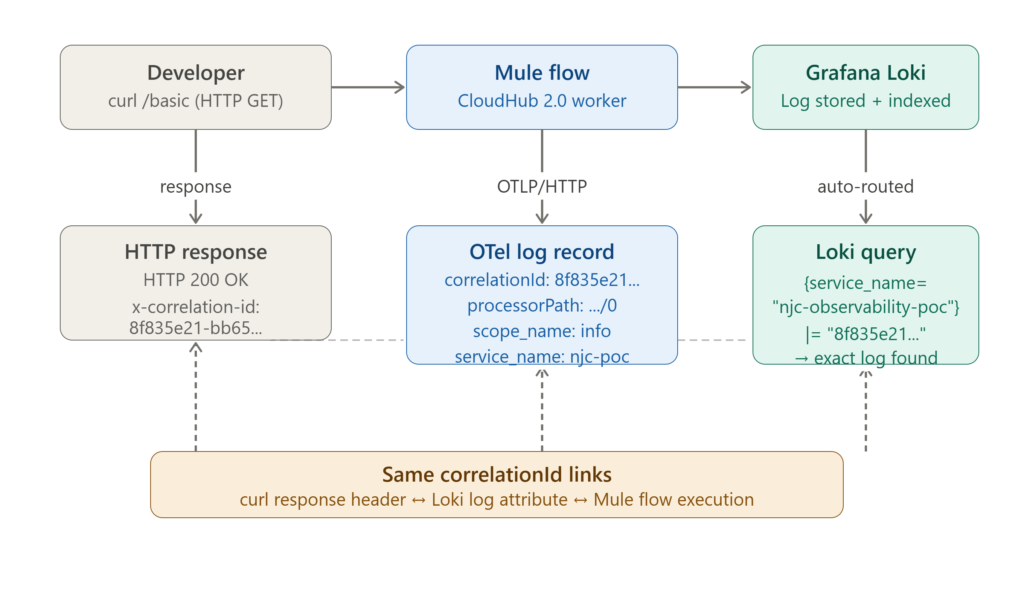
The /basic endpoint log captures the full HTTP request context: request path, method, headers, remote address, and the x-correlation-id that CloudHub 2.0 injects. This is the same correlation ID returned in the curl response, proving end-to-end traceability from the HTTP client all the way to Grafana.
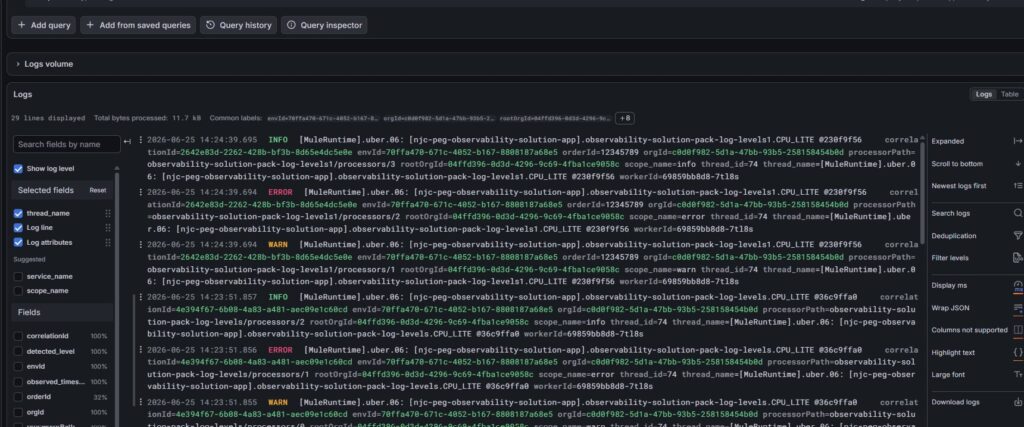
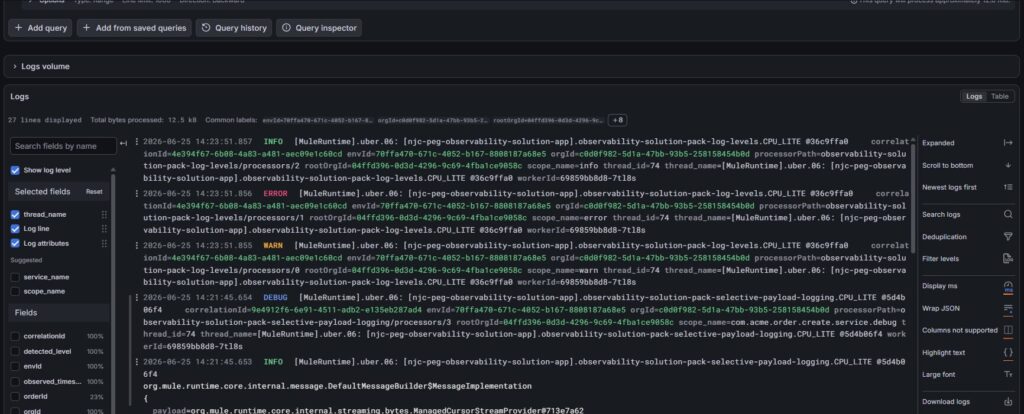
This single Grafana view confirms two things at once. The /loglevels flow fires WARN, ERROR, and INFO within milliseconds of each other under the samecorrelationId, confirming all severities are captured. The /logtracing flow shows the same three severities, but every log entry additionally carries orderId=12345789 the business context variable set via tracing:set-logging-variable. This means you can search Loki for a specific order ID and immediately find every log line associated with that business transaction.
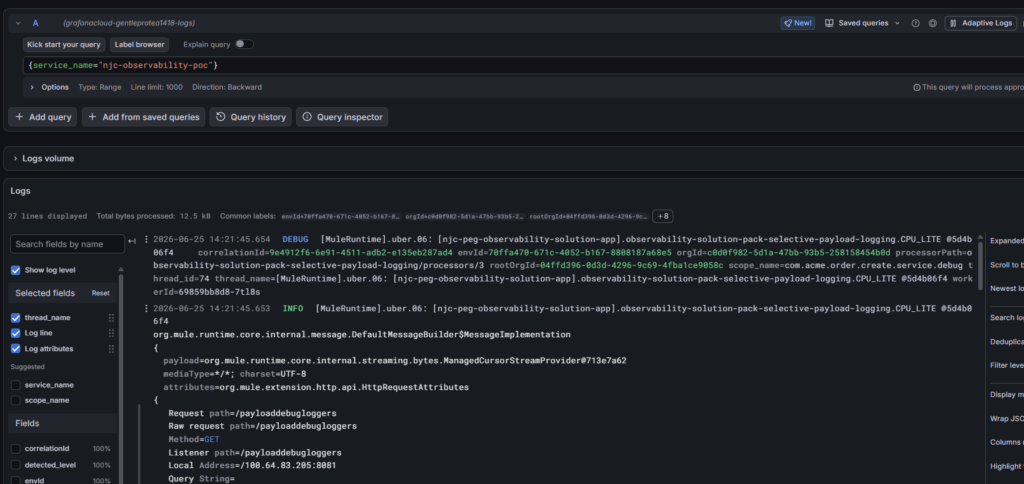
The selective DEBUG screenshot shows DEBUG-level logs arriving in Grafana with scope_name=com.acme.order.create.service.debug only logs from that specific category are elevated to DEBUG, leaving the rest of the application at INFO. This is a critical production pattern for diagnosing issues in specific flows without generating noise across the entire application.
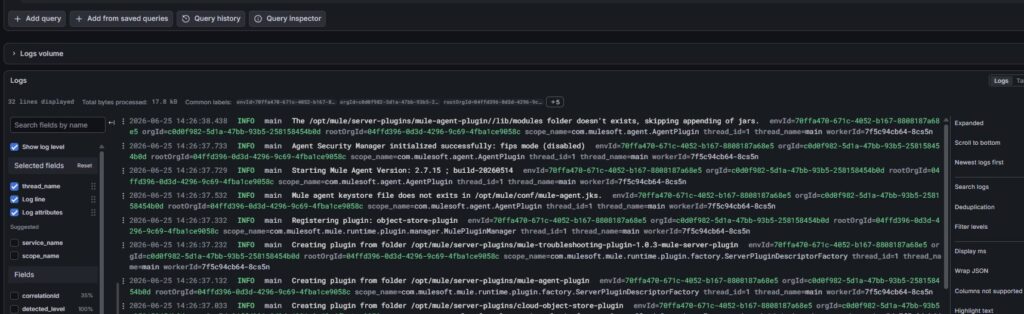
The Scheduler flow confirms continuous telemetry INFO logs arriving every second, proving the OTel pipeline from CloudHub 2.0 to Grafana Cloud Loki is live and healthy.
Querying by Endpoint in Grafana
Since each HTTP request gets a unique correlationId, you can isolate logs for any specific request precisely:
# All logs for a specific /basic hit
{service_name="njc-observability-poc"} |= "8f835e21-bb65-4b82-9b7f-9e106351c9c3"# All logs carrying orderId (logtracing endpoint)
{service_name="njc-observability-poc"} |= "12345789"# Filter out lifecycle noise, show only request execution logs
{service_name="njc-observability-poc"} != "Starting flow" != "Stopping flow" != "Initialising flow" != "shutdown"The correlationId is the key linking tool; it appears in both the HTTP response header (x-correlation-id) and in every Loki log attribute for that request, making it trivial to trace a specific client call through the entire system.
POC Results – What Was Confirmed on CloudHub 2.0 + Grafana Cloud
| What we tested | Result |
| Native OTel log export to Grafana Cloud | ✅ All severities shipping via OTLP/HTTP |
| CloudHub 2.0 deployment via Runtime Manager properties | ✅ No VM arg prefix needed, properties injected at runtime |
| Grafana Cloud Loki log routing | ✅ Logs auto-routed from OTLP endpoint to Loki |
| Distributed trace spans in Tempo | ✅ mule:flow → ee:transform → mule:logger hierarchy |
| Business context propagation | ✅ orderId=12345789 carried across all spans and logs |
| Selective DEBUG logging | ✅ Category-level DEBUG without global impact |
| HTTP request attributes in logs | ✅ Request path, method, headers, correlation ID captured |
| End-to-end correlation | ✅ x-correlation-id in curl response matches Loki log attribute |
Why This Matters for Enterprise MuleSoft Teams
| Before Mule 4.11 | With Mule 4.11 + Grafana Cloud on CloudHub 2.0 |
| External log shippers needed | Built into the runtime, zero infrastructure |
| Traces required custom instrumentation | Automatic span generation per flow |
| Business context lost in logs | Trace variables propagate orderId, customerId, etc. |
| Vendor-specific backends | Any OTel-compatible backend: Grafana, Datadog, Splunk |
| Complex infrastructure overhead | Properties in Runtime Manager, deploy and done |
| No correlation between HTTP client and logs | x-correlation-id links curl response to Loki entry |
For teams running MuleSoft on CloudHub 2.0 or Runtime Fabric, this is especially significant. You no longer need infrastructure-level access to ship observability data, no sidecar agents, no log forwarders. The application itself becomes the telemetry source, and Grafana Cloud becomes the single pane of glass for logs, traces, and metrics.
What’s Next: Phase 3
This POC establishes a fully working CloudHub 2.0 to Grafana Cloud OTel pipeline. The natural evolution is:
- Traces in Tempo: visualize distributed traces across flow executions with span-level latency breakdown
- Add metrics: Prometheus-compatible metrics from the Mule runtime (heap, thread pool, flow execution counts)
- Grafana Alerting: alert on ERROR spikes, latency thresholds, or flow failures firing to Slack or PagerDuty
- Multi-app tracing: distributed traces across multiple Mule apps and APIs via Flex Gateway
- Grafana Dashboard: unified dashboard combining Loki logs, Tempo traces, and Prometheus metrics in one view
Conclusion
OpenTelemetry support in Mule 4.11 combined with CloudHub 2.0 and Grafana Cloud is a significant step forward for MuleSoft observability. The entire pipeline from a running Mule application to a searchable, filterable, production-grade observability backend requires nothing more than a set of deployment properties in Anypoint Runtime Manager. No agents, no infrastructure, no code changes.
At NJC Labs, we believe this is the right foundation for production observability in any MuleSoft deployment. The POC confirmed that every log severity, every business context variable, and every HTTP request attribute flows cleanly from CloudHub 2.0 to Grafana Cloud Loki ready to query, alert on, and visualize the moment the application is deployed.