Running an OpenTelemetry Collector on Azure Container Apps for MuleSoft Logging
TECHNICAL SERIES | PART 2 OF 2
Why put the Collector in a container?
An OpenTelemetry Collector on Azure Container Apps gives you the same MuleSoft-to-Application Insights logging path as a VM, without a server to patch.
In an earlier post, we sent MuleSoft logs to Azure Monitor through a self-managed Collector on an Ubuntu VM. It worked well, but someone still had to look after that VM. This post moves the same Collector onto Azure Container Apps, Microsoft’s serverless container service.
The log path stays the same: MuleSoft Log4j2 Socket Appender → TCP port 5170 → OpenTelemetry Collector → Azure Monitor exporter → Application Insights; only the host changes.
In our deployment, logs reached Application Insights end to end. Here’s how to build it, using OpenTelemetry Collector Contrib 0.162.0 on the Consumption workload profile.
In Part 1, we explored how to send MuleSoft logs to Azure Monitor using a self-managed OpenTelemetry Collector on an Ubuntu VM. This article builds on that approach by deploying the Collector on Azure Container Apps.
Link Part 1 to:
https://njclabs.com/blog/mulesoft-azure-monitor-opentelemetry/
How it fits together
The Collector runs as a single Container App inside a VNet-connected environment, pulling its image from your own registry.
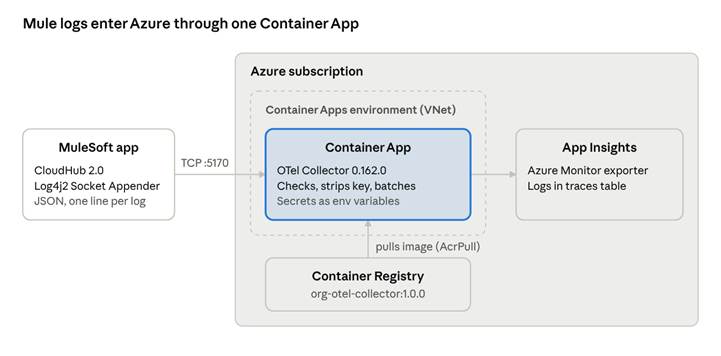
Azure layout · Mule app, Container App, registry and Application Insights
Mule sends logs to the app’s public TCP endpoint on port 5170. The app reads its secrets from environment variables and exports to Application Insights. The Collector also opens OTLP receivers on 4317 (gRPC) and 4318 (HTTP) for apps that speak OpenTelemetry directly.
Step by step: deploying it
The build has six stages: package the Collector as an image, push it to a registry, then create the network, the environment, the app and its ingress.
You’ll need:
- Azure permissions to create a VNet and subnet, a Container Apps environment, a Container App and role assignments.
- Docker Desktop and the Azure CLI (az login) on your machine.
- Your Application Insights connection string.
- A strong random ingest key, shared between the Collector and your Mule app.
- A working config.yaml (the full file is at the end of this post).
The examples use these generic names. Swap in your own:
| Resource | Example name |
| Resource group | org-monitoring-prod |
| Region | East US 2 |
| Container registry | orgotelregistry.azurecr.io |
| Image | org-otel-collector:1.0.0 |
| Virtual network | org-otel-vnet-eus2 (10.0.0.0/16) |
| Subnet | aca-infrastructure-subnet (10.0.1.0/27) |
| Container Apps environment | org-otel-env-eus2 |
| Container App | org-otel-collector |
| Application Insights | org-mulesoft-prod |
1. Build the Collector image
In your project folder, create a Dockerfile that copies your config into the official image:
FROM otel/opentelemetry-collector-contrib:0.162.0
COPY config.yaml /etc/otelcol-contrib/config.yaml
ENTRYPOINT ["/otelcol-contrib"]
CMD ["--config=/etc/otelcol-contrib/config.yaml"]
Check the config with the same Collector version before building. No error means it’s valid:
docker run --rm \
  -v "$PWD/config.yaml:/etc/otelcol-contrib/config.yaml:ro" \
  otel/opentelemetry-collector-contrib:0.162.0 \
  validate --config=/etc/otelcol-contrib/config.yaml
Then build for linux/amd64. This matters if you’re on an Apple Silicon Mac, because Azure runs Linux on AMD64:
docker buildx build --platform linux/amd64 \
  -t orgotelregistry.azurecr.io/org-otel-collector:1.0.0 \
  --load.
2. Push it to Azure Container Registry
az login
az acr login --name orgotelregistry
docker push orgotelregistry.azurecr.io/org-otel-collector:1.0.0
az acr repository show-tags --name orgotelregistry --repository org-otel-collector --output table
3. Create the virtual network
In the Azure portal, open Virtual networks:
- Create the VNet in your resource group and region, with address space 10.0.0.0/16.
- Add a subnet with range 10.0.1.0/27.
- Delegate the subnet to Microsoft.App/environments.
- Leave “Enable private subnet (no default outbound access)” unchecked.
We didn’t add a NAT gateway, network security group, or route table for the first deployment. Decide whether you need them for production.
One lesson learned: our first attempt in East US hit a regional capacity error, so we deployed in East US 2. If you see the same error, try a nearby region.
4. Create the Container Apps environment
- Create a Container Apps environment in the same resource group and region.
- Choose the Workload profiles environment type.
- Turn on VNet integration and pick the VNet and subnet from step 3.
- Connect a Log Analytics workspace (the portal can create a new one).
- Create it and wait for the provisioning state to read Succeeded.
If you already have monitoring resources, such as an existing Application Insights or Log Analytics workspace, leave them alone. Don’t delete them during cleanup.
5. Create the Container App
- Create a Container App in the new environment.
- Use the image orgotelregistry.azurecr.io/org-otel-collector:1.0.0.
- For registry login, choose the system-assigned managed identity and give it the AcrPull role. If the image won’t pull, check this role first.
- Choose the Consumption workload profile. We started with 0.5 vCPU and 1 GiB memory.
- Leave the container command and arguments blank. The Dockerfile already tells the Collector where its config is.
Then add two secrets, referenced as environment variables. The names must match the config exactly:
| Name | Value | What it’s for |
| APPLICATIONINSIGHTS_CONNECTION_STRING | Copied from Application Insights → Overview | Where the Collector sends logs |
| MULE_LOG_INGEST_KEY | A strong random secret | Lets the Collector reject logs that don’t carry it |
Never paste these values into email, tickets, screenshots or source control.
6. Turn on TCP ingress
Open the Container App and go to Ingress:
- Enable ingress and choose TCP as the type.
- Set both the target port and the exposed port to 5170.
- Save, then copy the full TCP endpoint the portal shows. It looks like org-otel-collector–<revision-id>.<environment-id>.eastus2.azurecontainerapps.io:5170.
Always re-check this endpoint in the portal before using it, because it can change if the app or revision is recreated. Also note that the environment shows a static IP address; Mule should point to the endpoint name, not that IP.
For our first test, ingress accepted traffic from anywhere. That’s fine for a proof of concept, but not for production. See the production tips below.
Connecting MuleSoft and testing
Point the Mule app’s Socket Appender at the new endpoint, send a marked test log, and look for it in Application Insights.
In your Mule app’s properties, set the host to the endpoint you copied from the Ingress page:
org.logs.host=org-otel-collector--<revision-id>.<environment-id>.eastus2.azurecontainerapps.io
org.logs.port=5170
org.logs.protocol=TCP
Keep the ingest key in the Mule deployment’s secure properties, not in source code. Each log record must include the fields config.yaml expects: time, level, app, env, instance, ingestKey, and message. Then redeploy or restart the app through your normal release process.
To test it:
- In the portal, open Container Apps → your app → Revisions and replicas, and confirm the active revision is running.
- Open the app’s Log stream and look for startup, parsing, or export errors.
- Trigger a test log from Mule with a unique message, such as LOG4J2-TEST-<timestamp>.
- In Application Insights, open Logs and run:
traces
| where timestamp > ago(30m)
| where message contains "LOG4J2-TEST"
| order by timestamp desc
No results? Depending on the exporter and schema, logs may land in a different table, such as AppTraces. Check the table list in Logs.
A visible log proves the basic path works. Restart recovery, sustained volume, security restrictions and alerting still need their own tests.
Troubleshooting and production tips
Most problems come down to the endpoint, the registry role, or a mismatched secret; most production work is about locking down the open ingress.
| Symptom | What to check |
| Container App won’t start | Revision events and container logs; that the image tag exists, the identity has AcrPull, and the config parses |
| Image pull fails | Registry name, repository, and tag; the managed identity and its ACRPull role scope |
| No logs reach the Collector | The current ingress endpoint and port 5170; Mule’s outbound connectivity; the Log4j2 host and port |
| Logs reach the Collector but not Azure | That APPLICATIONINSIGHTS_CONNECTION_STRING is set and points at the right resource; exporter errors |
| Logs are filtered out | That MULE_LOG_INGEST_KEY matches the app’s ingestKey exactly |
| Wrong time or severity | The time format and that level values map to severity |
| Endpoint stopped working | Re-copy it from the Ingress page; don’t trust an old one |
| Unexpected costs | Replica scaling, workload profile, Log Analytics ingestion and retention, registry storage. Consumption is usage-based, not free |
Before you call it production-ready:
- Restrict ingress. Allow only your approved MuleSoft/CloudHub egress IP ranges. Don’t leave “allow all” without a signed-off risk acceptance.
- Encrypt the log path. Enable TLS on the TCP receiver if your setup supports it, or put a secured proxy in front. An ingest key alone isn’t enough protection.
- Manage the ingest key. Make it strong and unique, rotate it regularly, and keep it in managed secrets.
- Close unused ports. The config also opens OTLP on 4317 and 4318. These skip the ingest-key check, so don’t expose them publicly unless you need them and protect them separately.
- Review the debug exporter. It helps during setup but produces verbose logs.
- Set up alerts for missing logs, Collector restarts, export failures and unusual volume.
- Test resilience. Restart a revision and confirm logs resume. Run a realistic volume test.
- Keep a rollback. Validate every config change locally, and keep a known-good image tag ready.
Wrapping up
Azure Container Apps makes a tidy, serverless home for the Collector: the MuleSoft-to-Application-Insights path works with no VM to maintain. Finish the security, alerting, and cost reviews above before trusting it with production traffic.
The full config.yaml
This is the complete config baked into the image. Secrets come from environment variables, so never put real values in this file. Keep it in version control.
receivers:
  tcp_log/mule:
    listen_address: 0.0.0.0:5170
    max_log_size: 1MiB
    # For production, enable TLS and mount the certificate/key securely.
    # tls:
    #   cert_file: /etc/otelcol-contrib/tls/fullchain.pem
    #   key_file: /etc/otelcol-contrib/tls/privkey.pem
    operators:
      - type: json_parser
        parse_from: body
        on_error: drop_quiet
      - type: move
        from: attributes.message
        to: body
      - type: move
        from: attributes.app
        to: resource["service.name"]
      - type: move
        from: attributes.instance
        to: resource["service.instance.id"]
      - type: move
        from: attributes.env
        to: resource["deployment.environment.name"]
      - type: remove
        if: 'attributes.time != nil'
        field: attributes.time
      - type: remove
        if: 'attributes.level != nil'
        field: attributes.level
      - type: remove
        if: 'attributes.exception == ""'
        field: attributes.exception
  otlp:
    protocols:
      grpc:
        endpoint: 0.0.0.0:4317
      http:
        endpoint: 0.0.0.0:4318

processors:
  filter/ingest_key:
    error_mode: ignore
    logs:
      log_record:
        - 'log.attributes["ingestKey"] != "${env:MULE_LOG_INGEST_KEY}"'
  transform/remove_key:
    error_mode: ignore
    log_statements:
      - context: log
        statements:
          - delete_key(log.attributes, "ingestKey")
  batch:
    timeout: 10s
    send_batch_size: 512

exporters:
  azure_monitor:
    connection_string: "${env:APPLICATIONINSIGHTS_CONNECTION_STRING}"
  debug:
    verbosity: basic

service:
  pipelines:
    # MuleSoft Log4j2 JSON over TCP: validate the key, remove it, then export.
    logs/mule:
      receivers: [tcp_log/mule]
      processors: [filter/ingest_key, transform/remove_key, batch]
      exporters: [azure_monitor, debug]
    # OTLP pipelines for clients that send OpenTelemetry directly.
    logs:
      receivers: [otlp]
      processors: [batch]
      exporters: [azure_monitor, debug]
    traces:
      receivers: [otlp]
      processors: [batch]
      exporters: [azure_monitor, debug]
    metrics:
      receivers: [otlp]
      processors: [batch]
      exporters: [azure_monitor, debug]
Validate it against the exact Collector Contrib image (0.162.0) before every rebuild, especially after editing processor expressions or receiver settings.
Read Part 1 of This Series
Haven’t explored the initial setup yet? Start with Part 1 to understand how to send MuleSoft logs to Azure Monitor using a self-managed OpenTelemetry Collector on an Ubuntu VM, without upgrading your Anypoint subscription.
Read Part 1: Sending MuleSoft Logs to Azure Monitor with OpenTelemetry – Without a Subscription Upgrade