Sending MuleSoft Logs to Azure Monitor with OpenTelemetry – Without a Subscription Upgrade
TECHNICAL SERIES | PART 1 OF 2
This article is Part 1 of our two-part technical series. We explore how to send MuleSoft logs to Azure Monitor using OpenTelemetry without upgrading your Anypoint subscription. In Part 2, we will cover running an OpenTelemetry Collector on Azure Container Apps for MuleSoft logging.
The problem: a deprecated logging appender
You can get MuleSoft logs into Azure Monitor today, on Mule 4.9 LTS and a Basic Anypoint subscription, with no custom code. The trick is a small OpenTelemetry Collector that you run yourself.
Many MuleSoft teams still ship logs to Application Insights with the Java 2.x Log4j2 appender. Microsoft has deprecated it, and it relies on legacy instrumentation-key ingestion. Sooner or later it has to go.
In this post, I walk through a replacement we built and validated end-to-end in a proof of concept. Here is what it gives you:
- No upgrade needed. It runs on the current Mule runtime (4.9 LTS) and a Basic Anypoint Monitoring subscription.
- No custom code. Only log4j2.xml and a few deployment properties change.
- Safer secrets. The Azure connection string lives only on the Collector. Mule apps no longer hold any Azure key.
- Nothing breaks. Runtime Manager logging carries on as before.
- Supported. MuleSoft Support confirmed the approach works on CloudHub 2.0.
- Future-ready. The same Collector can receive MuleSoft’s native Direct Telemetry Stream later.
Why not use MuleSoft’s built-in exporter?
The native options need a higher subscription tier, so a self-managed Collector is the practical route for most teams on Basic.
Anypoint Monitoring has a Telemetry Exporter and a Direct Telemetry Stream that send telemetry straight to external platforms. Both require an Anypoint Integration Advanced or Titanium subscription. We checked the alternatives with MuleSoft Support before committing. Here is what they told us:
| Question | MuleSoft’s answer |
| Log4j2 Socket Appender on CloudHub 2.0? | Supported. Asynchronous appenders defined in log4j2.xml, including the built-in Socket Appender, work on CloudHub 2.0. |
| Custom Log4j2 plugin classes? | Not supported. Plugin classes packaged inside a Mule app don’t load on CloudHub 2.0 or Runtime Fabric. This rules out the OpenTelemetry Java Log4j2 appender. |
| Outbound traffic to port 5170? | No restrictions on non-standard outbound TCP ports. TLS must be 1.2 or later. |
| Effect on Runtime Manager logs? | None. A custom appender is additive. |
| Telemetry Exporter / Direct Telemetry Stream? | Not available on the Basic tier. Needs Advanced or Titanium. |
| Native OpenTelemetry on an LTS release? | Mule 4.14 LTS (planned February 2027) is expected to bring Direct Telemetry Stream to LTS. |
One terminology point is worth keeping straight. What we use is the Log4j2 Socket Appender sending JSON over TCP to an OpenTelemetry Collector. It is not the OpenTelemetry Java Log4j2 Appender.
How it works
Each Mule app writes every log event as one line of JSON to a Collector you run on a small VM. The Collector checks it, tidies it, and forwards it to Application Insights.
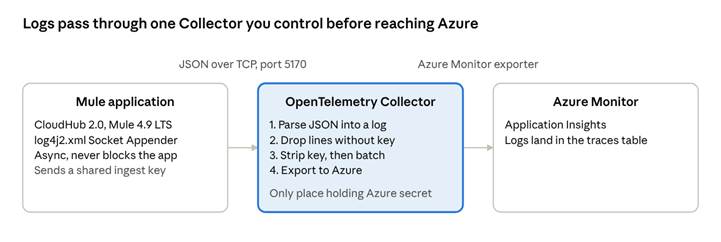
logging path · Mule app to Collector to Azure Monitor
The Collector is the only component that knows the Azure connection string. Mule apps just need its address and a shared ingest key.
Step by step: building it
The whole setup is one small Linux server plus a few lines of Mule configuration. You’ll need these before you start:
- An Ubuntu 24.04 LTS VM (1 vCPU / 2 GB RAM is enough for a POC) with a public IPv4 address, a cloud firewall and SSH access with sudo rights.
- An Azure Application Insights resource and its connection string.
- Anypoint Runtime Manager access to edit your app’s log4j2.xml and properties.
- Inbound TCP 5170 open from MuleSoft to the server.
1. Install the Collector
We used OpenTelemetry Collector Contrib 0.162.0 (Linux AMD64):
sudo apt update && sudo apt install -y wget curl tar
cd /tmp
wget https://github.com/open-telemetry/opentelemetry-collector-releases/releases/download/v0.162.0/otelcol-contrib_0.162.0_linux_amd64.tar.gz
tar -xzf otelcol-contrib_0.162.0_linux_amd64.tar.gz
sudo mkdir -p /opt/otelcol-contrib
sudo mv otelcol-contrib /opt/otelcol-contrib/
/opt/otelcol-contrib/otelcol-contrib --version
Then create a locked-down service account and its folders:
sudo useradd --system --no-create-home --shell /usr/sbin/nologin otelcol
sudo mkdir -p /etc/otelcol-contrib /var/lib/otelcol-contrib
sudo chown -R otelcol:otelcol /etc/otelcol-contrib /var/lib/otelcol-contrib
2. Keep the secrets in one protected file
The Azure connection string and a shared “ingest key” go in an environment file, never in the config itself. Generate any long random string for the ingest key.
# /etc/otelcol-contrib/otelcol.env
APPLICATIONINSIGHTS_CONNECTION_STRING=<your connection string>
MULE_LOG_INGEST_KEY=<generated secret>
sudo chown root:otelcol /etc/otelcol-contrib/otelcol.env
sudo chmod 640 /etc/otelcol-contrib/otelcol.env3. Configure the Collector to listen on port 5170
In /etc/otelcol-contrib/config.yaml, add a TCP log receiver. It parses each JSON line and maps the fields to OpenTelemetry: the app name becomes service.name, the environment becomes deployment.environment.name, and the instance becomes service.instance.id.
receivers:
  tcp_log/mule:
    listen_address: 0.0.0.0:5170
    max_log_size: 1MiB
    operators:
      - type: json_parser
        parse_from: body
        on_error: drop_quiet
        timestamp: { parse_from: attributes.time, layout_type: epoch, layout: ms }
        severity:  { parse_from: attributes.level }
      - type: move
        from: attributes.message
        to: body
      - type: move
        from: attributes.app
        to: resource["service.name"]
      - type: move
        from: attributes.instance
        to: resource["service.instance.id"]
      - type: move
        from: attributes.env
        to: resource["deployment.environment.name"]
Two processors check the ingest key, then strip it so it never reaches Azure:
processors:
  filter/ingest_key:
    error_mode: ignore
    logs:
      log_record:
        - 'log.attributes["ingestKey"] != "${env:MULE_LOG_INGEST_KEY}"'
  transform/remove_key:
    error_mode: ignore
    log_statements:
      - context: log
        statements:
          - delete_key(log.attributes, "ingestKey")
  batch:
    timeout: 10s
    send_batch_size: 512

exporters:
  azure_monitor:
    connection_string: "${env:APPLICATIONINSIGHTS_CONNECTION_STRING}"
Use the name azure_monitor. Collector 0.162.0 flags the older azuremonitor alias as deprecated.
4. Run it as a service
Create /etc/systemd/system/otelcol-contrib.service so the Collector starts on boot and restarts on failure:
[Unit]
Description=OpenTelemetry Collector Contrib
After=network-online.target

[Service]
User=otelcol
Group=otelcol
EnvironmentFile=/etc/otelcol-contrib/otelcol.env
ExecStart=/opt/otelcol-contrib/otelcol-contrib --config /etc/otelcol-contrib/config.yaml
Restart=on-failure
NoNewPrivileges=true
ProtectSystem=strict
ReadWritePaths=/var/lib/otelcol-contrib

[Install]
WantedBy=multi-user.target
sudo systemctl daemon-reload
sudo systemctl enable --now otelcol-contrib
sudo ufw allow 5170/tcp5. Point the Mule app at the Collector
Add a Socket Appender wrapped in an Async appender to log4j2.xml. The async wrapper means your app never waits on the network.
<Socket name="collectorSocket"
        host="${sys:org.logs.host:-localhost}"
        port="${sys:org.logs.port:-5170}"
        protocol="${sys:org.logs.protocol:-TCP}"
        immediateFail="true" reconnectDelayMillis="5000" connectTimeoutMillis="5000">
  <SslConfiguration protocol="TLSv1.2" verifyHostName="true" />
  <PatternLayout alwaysWriteExceptions="false"
    pattern='{"time":%d{UNIX_MILLIS},"level":"%p","logger":"%c","thread":"%enc{%t}{JSON}","correlationId":"%X{correlationId}","app":"${sys:org.otel.service.name:-org-azure-logs}","env":"${sys:mule.env:-local}","instance":"${env:HOSTNAME:-local}","ingestKey":"${sys:org.logs.ingestKey:-}","message":"%enc{%m}{JSON}","exception":"%enc{%throwable}{JSON}"}%n' />
</Socket>
<Async name="collector" blocking="false" bufferSize="8192">
  <AppenderRef ref="collectorSocket" />
</Async>
Then set these as Runtime Manager application properties:
org.logs.host=<COLLECTOR_PUBLIC_IP>
org.logs.port=5170
org.logs.protocol=TCP
org.otel.service.name=org-customer-api
org.logs.ingestKey=<shared-secret>
For each extra app, only org.otel.service.name changes (for example org-order-api). The Collector config stays the same for all of them.
Testing it end to end
You can prove the whole chain with two commands and one query.
First, check that the port is reachable from a test machine:
nc -vz <COLLECTOR_PUBLIC_IP> 5170Next, send one fake log line, exactly as a Mule app would:
printf '%s\n' '{"time":1791290000000,"level":"INFO","app":"org-test-api","env":"POC","instance":"test-01","ingestKey":"<KEY>","message":"LOG4J2-TEST","exception":""}' | nc <COLLECTOR_PUBLIC_IP> 5170Finally, open Application Insights → Logs and run:
traces
| where timestamp > ago(15m)
| where message contains "LOG4J2-TEST"
| order by timestamp desc
In our POC, the test line showed up in the traces table. A real Mule message (“Hello OTEL Logs”) also arrived, carrying the correlation ID, environment and organization context, instrumentation scope and cloud role name.
If something doesn’t arrive, these are the usual suspects:
| Symptom | What to check |
| Mule can’t connect | CloudHub egress route, cloud firewall, UFW and whether the port is listening |
| Collector runs but nothing in Azure | The connection string, Collector logs and azure_monitor exporter errors |
| Logs are delayed | Batch settings, network latency and exporter queue |
| Logs are dropped | Mule exporter queue and Collector processing errors |
To follow the Collector live, run sudo journalctl -u otelcol-contrib -f.
Before you go to production
The POC setup is deliberately open; lock down the network, add TLS and plan for scale before real traffic flows.
| Area | What to do |
| Network | Never leave port 5170 open to the whole internet. Allow only your approved CloudHub egress IPs, at both the cloud firewall and UFW. |
| Encryption | Enable TLS on the TCP receiver (the config has commented-out tls: lines ready for your certificate). |
| DNS | Use a name such as otel.<your-domain> instead of a raw IP address. |
| Secrets | Keep the connection string and ingest key in a protected store. Never put them in Mule source code or Git. |
| SSH | Restrict SSH to admin IP addresses. |
| Sizing | Load-test the Collector against your real log volume. |
| High availability | For critical telemetry, run several Collectors behind a load balancer. |
| Monitoring | Watch Collector health, queue backpressure, dropped telemetry and exporter failures. |
| Change control | Pin the Collector version and test upgrades before rolling them out. |
| Data hygiene | Review logs for sensitive data before export, and apply Application Insights retention and access rules per your organization’s policy. |
Wrapping up
A self-managed OpenTelemetry Collector gets MuleSoft logs into Azure Monitor today, without waiting for a subscription upgrade or a new LTS release.
The same Collector also accepts standard OpenTelemetry data over OTLP (HTTP on 4318, gRPC on 4317). So when your organization moves to MuleSoft’s native Direct Telemetry Stream, you can point it at the server you already run.
Continue to Part 2: Deploying OpenTelemetry Collector on Azure Container Apps
In Part 2 of this series, we explore how to run an OpenTelemetry Collector on Azure Container Apps for MuleSoft logging, taking the integration approach further with an Azure-native deployment.
Further reading
- MuleSoft: Integrating with your logging system using Log4j (CloudHub 2.0)
- MuleSoft: OpenTelemetry support in Mule runtime
- MuleSoft: Edge and LTS releases
- MuleSoft: CloudHub 2.0 networking guide
- Salesforce Help: Custom Log4j2 plugin classes on CloudHub 2.0 / RTF
- OpenTelemetry Collector: Linux installation
- Collector Contrib: TCP log receiver
- Collector Contrib: Azure Monitor exporter