In this blog, we explain how to create a custom Grafana dashboard step by step. First, we describe what Grafana is and why teams use it for monitoring. Next, we walk through the download and installation process for Grafana and its plugins on Windows. After that, we demonstrate Grafana dashboard creation using MySQL as the data source. Finally, we explain how to build a Grafana visualization dashboard by writing MySQL queries and reviewing the advantages and disadvantages of Grafana.
Grafana is one of the most popular open source tools used for monitoring applications and visualizing operational metrics, especially when organizations centralize analytics through platforms such as Salesforce Data Cloud Services. As a result, teams use it to analyze system failures, monitor servers, and track business performance. Moreover, Grafana simplifies dashboard creation because users can drag and drop panels, resize layouts, and filter data by time range. Therefore, building a custom Grafana dashboard becomes faster and more efficient.
What is Grafana?
Grafana is an open source analytics and visualization platform that helps teams build a Grafana monitoring dashboard with fully customizable panels. In addition, Grafana connects to many data sources, including Graphite, InfluxDB, Prometheus, Elasticsearch, Logz.io, MySQL, and Amazon CloudWatch.
Using Grafana, teams can combine metrics, logs, and tracing data into a single custom Grafana dashboard. Each dashboard panel can display graphs, singlestats, tables, heatmaps, or free text. Furthermore, Grafana supports both proprietary and community developed plugins. As a result, users can extend Grafana dashboard creation with additional visual elements such as clocks or world maps. Grafana also enables alert configuration, which helps teams receive notifications through email, Slack, or text messages.
Install Grafana in your local based on your OS using the below link:
Install on Windows | Grafana Labs
- Click Download the installer.
- Open and run the installer.
Note: Grafana uses port 3000 by default. However, Windows may require additional permissions for this port. Therefore, changing the port often simplifies local access.
- Navigate to the conf directory and copy sample.ini to custom.ini. Always edit custom.ini instead of defaults.ini.
- Edit custom.ini and uncomment the http_port configuration option. Then, change the port to 8080 or another available port. As a result, Grafana starts without elevated privileges.
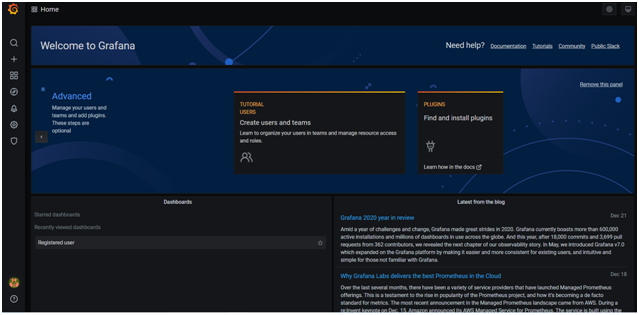
The default username and password are admin and admin. After installation, you can access the custom Grafana dashboard environment at http://localhost:3000.
Integrating MYSQL with Grafana
We need to add MYSQL as a data source:
- Go to Settings > Configuration > Data Sources > Add Data Source > MySQL
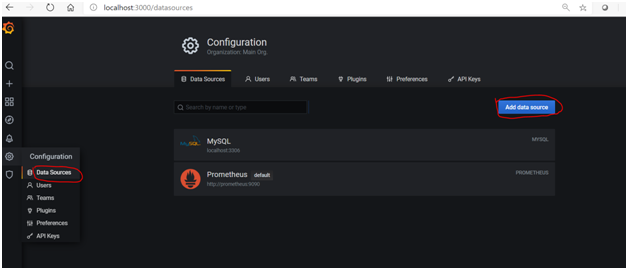
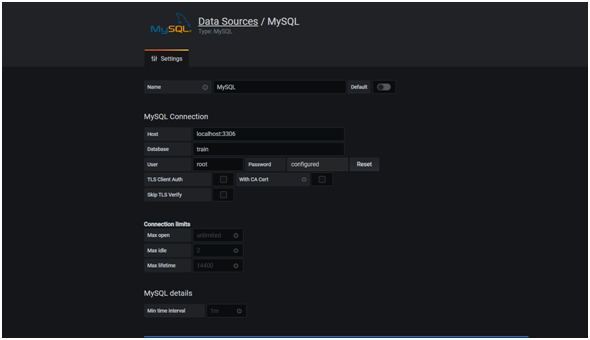
- Next, enter the MySQL connection details such as host, database, username, and password. Then, click Save and Test. As a result, MySQL becomes available for Grafana dashboard creation.
- Create a panel to begin building a Grafana visualization dashboard and save it to a dashboard.
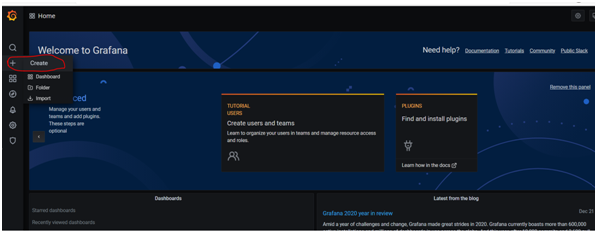
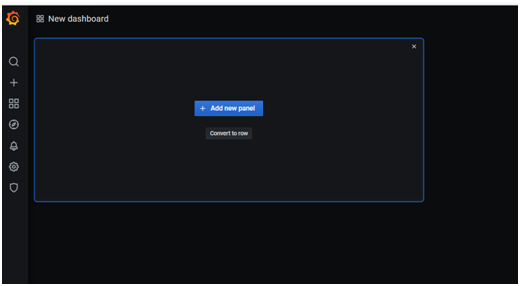
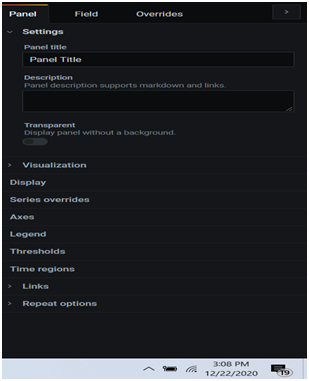
- Add a new panel. After that, the panel editor screen appears.
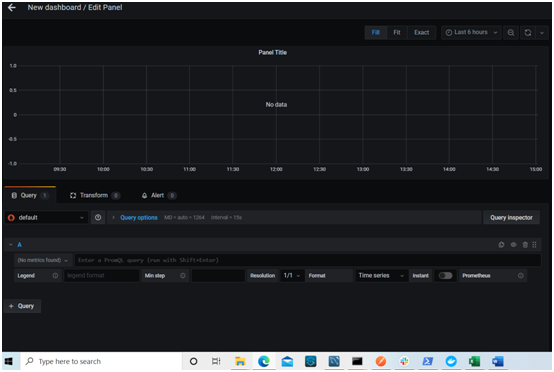
- Select MySQL from the data source dropdown in the query section. This step ensures the custom Grafana dashboard pulls data from the correct database.
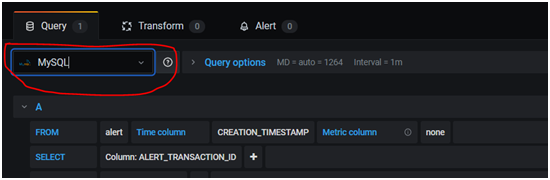
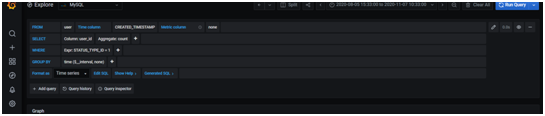
- Once the database is selected, all tables appear in the dropdown. Then, select the required query. For example, the following query displays the total number of registered users from the user table.
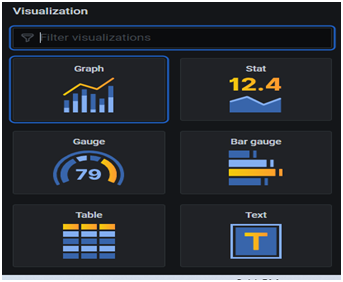
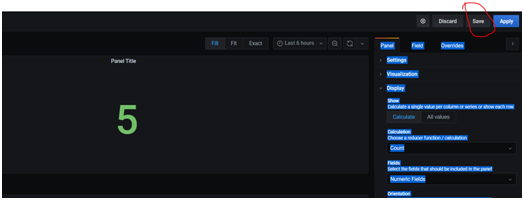
- Choose the visualization mode from the side panel. As a result, the data appears in the selected format.
- Grafana supports multiple visualization types, including graphs, gauges, tables, and stat panels. Therefore, teams can tailor the Grafana monitoring dashboard to specific business requirements.
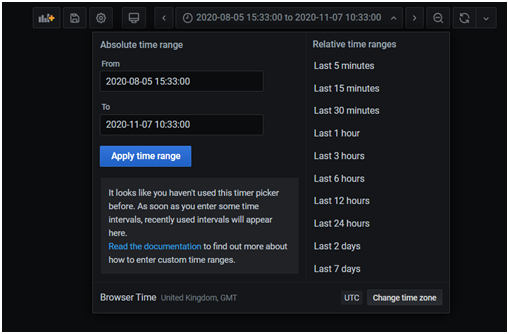
- You can define a time range to filter data based on a selected period. Consequently, the custom Grafana dashboard displays relevant time based insights.
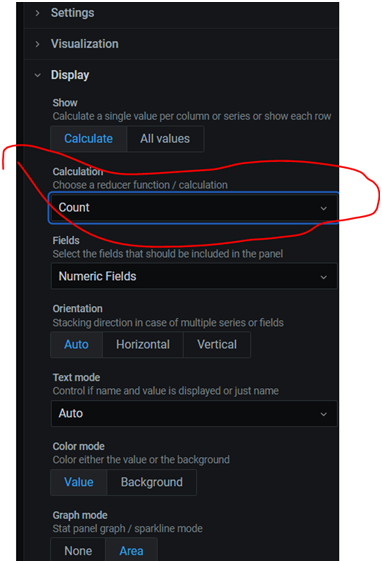
- In the display section, select how Grafana calculates values, such as average or count.
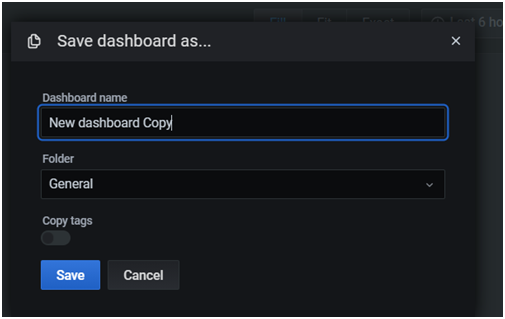
- Click Save
- Provide a name for the visualization. This step stores the panel in the Grafana visualization dashboard.
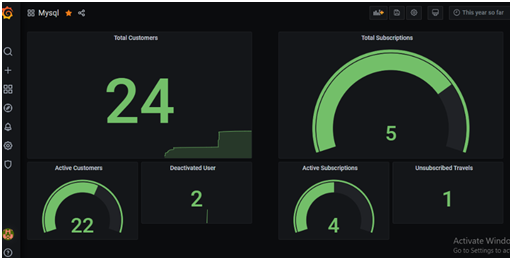
- You can continue adding visualizations to the same dashboard. As a result, the custom Grafana dashboard evolves into a complete monitoring solution.
Adding community created plugins:
Community created plugins extend Grafana dashboard creation by adding new data sources, panels, and applications. You can download plugins from the Grafana plugins repository. In addition, you can install some plugins using the Grafana CLI. Alternatively, you can extract plugin files directly into the Grafana plugins directory. After installation, the plugins become available in the Grafana monitoring dashboard.
Advantages of Grafana:
- Highly customizable custom Grafana dashboard interface with templates and annotations
- Easy integration with almost every major data source
- Built in alerting that helps reduce downtime and operational risk
Disadvantages of Grafana:
- Some data sources restrict advanced custom queries
- Filtering can require additional time during Grafana dashboard creation
- Limited plugin availability in the default installation