In this blog you will see how we can integrate studio logs with ELK and thereafter see the desired data in different formats in Grafana.
The ELK stack is offered by Elastic and is named after 3 open source components Elasticsearch, Logstash and Kibana. Here Elasticsearch is the storage part of the stack responsible for storing the logs. Kibana supports and facilitates navigation and visualization of logs. Logstash receives the logs, parses them and feeds it to Elasticsearch to be consumed by Kibana.
A pictorial representation of the link among the 3 can be seen below:

Grafana on the other hand is an open source visualization and analytics software. It allows you to query, visualize, alert on, and explore your metrics no matter where they are stored. In simple words, it helps us to transform our data into attractive well formed formats.
(Note: We are not focusing on cloudhub logs (but Studio logs) sync with ELK and Grafana in this blog. However the method to externalize CloudHub logs is explained towards the end)
We just read that Kibana is used for visualization and analysis, so there can be space for questions like why going for Grafana when we have a visualization tool handy already? When we focus on visualizing metrics such as system CPU, memory, disk and I/O utilization, Grafana is the sole winner. On the other side Kibana is used primarily for analyzing log messages.
Installation
- ELK stack running in the local machine
- Grafana running in the local machine
- Anypoint Studio
Download:
(Make sure to download the latest version for experiencing the latest features of these tools)
Procedure
This blog follows the pattern where the windows version of all the above is downloaded. In the case of Elasticsearch, unzip the downloaded file and run the elasticsearch.bat file inside the bin folder.

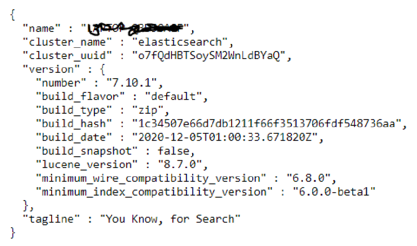
Look for the keyword started in the command prompt console to make sure that elasticsearch is up and running. We can confirm this by visiting http://localhost:9200 from the local machine. (A JSON data structure will be displayed mentioning the laptop name, elastic version etc. as given below)
For Kibana also, unzip the file and run the kibana.bat file inside the bin folder.

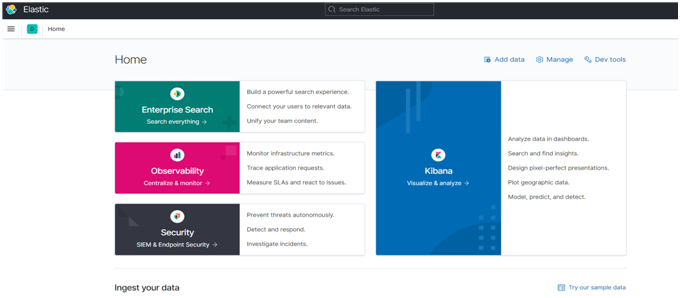
Look for the highlighted statement above to confirm that Kibana is running in the local machine. This can also be confirmed by visiting http://localhost:5601. A visual interface will be opened up as below:
Since we are dealing with synchronization of Studio logs let’s visit studio premises now and then later bring up Logstash and Grafana server.
Build a sample POC in Anypoint Studio for log generation. A snapshot of the POC is given below:
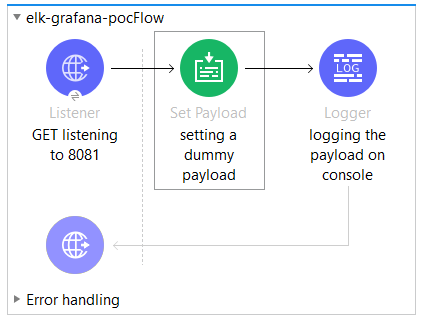
The above application logs a dummy payload to the console when accessed via the port 8081 as:

So we basically want all the Studio console logs to be in sync with ELK and thereafter should be able to visualize them in Kibana and Grafana. This can be achieved by following the first step of tweaking the log4j2 file of the Mule application as given below:
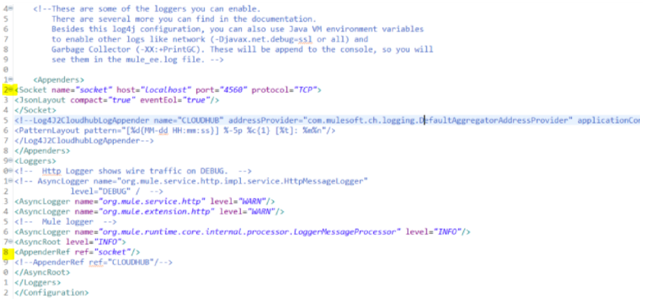
Here we can see that a socket has been defined to port 4560, (we can give any available port in our machine) this will be the port that our Logstash would be listening to for logs retrieval from the application. (Line no 2). Well done! Our configuration part in AnypointStudio is complete!!
Note: Link to log4j2 file
As mentioned earlier we are still left to bring up the Logstash and Grafana server for the completion of our tasks. Logstash’s working can be controlled and achieved using a logstash pipeline/config file. Let’s unzip the logstash’s downloaded file just like how we did for Elasticsearch and Kibana. Look for a folder called config and create a custom logstash config file as .config as below:
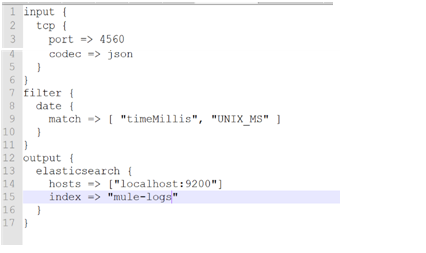
Note: Link to sample .config Logstash file
In a ground-level, logstash config file comes with three steps or categories, input section, filter section and output section. Input section is the part of the file that looks for the incoming logs/data(in our case we are sending all our studio application logs to the TCP port 4560 as configured in the log4j2 file, which is why in the logstash config file we are listening to the same port). In the filter section we are just filtering the collected logs based on timestamp. In the output section these logs are fed to Elasticsearch to be consumed by Kibana. Note that the index name is the name that will be appearing as heading for our log data in Kibana visual UI. (In this case we have hardcoded the index name, we can also make it dynamic by tweaking the logstash config file which will be covered in the upcoming blogs).
Note: Ruby language is used for structuring Logstash config files.
After setting up the config file open the Logstash batch file by remaining at the bin directory and parallelly linking the config file as:
logstash.bat -f .config
And look for the successful message to confirm that Logstash is running to take the logs.

Let’s see if the logs are now getting displayed in Elastic and Kibana via Logstash.
Note that all the three Elastic, Kibana and Logstash is now running in our local system in different ports. Let’s go to anypoint studio now and run our application and also access the same via the configured application port using Postman or any other clients (In this case our mule application is running in port 8081).
Open http://localhost:5601 after this and go to Manage index lifecycle in the homepage towards the bottom.

Select this and then select index pattern in the left panel under Kibana. A message saying that our log data is waiting and that index patterns have to be created to view them will be displayed on the screen. Click on create index pattern. Our index name can be seen there, copy the index name and paste it under index pattern name and click next step. In the next window choose the timefield as @timestamp from the drop-down and click on create index pattern.
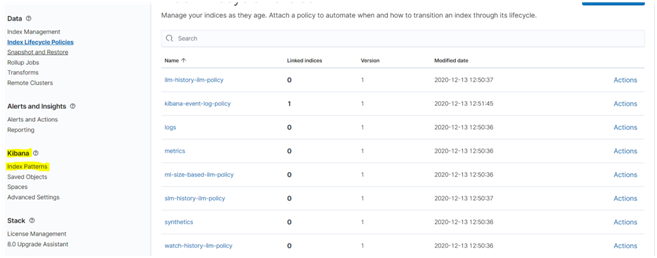
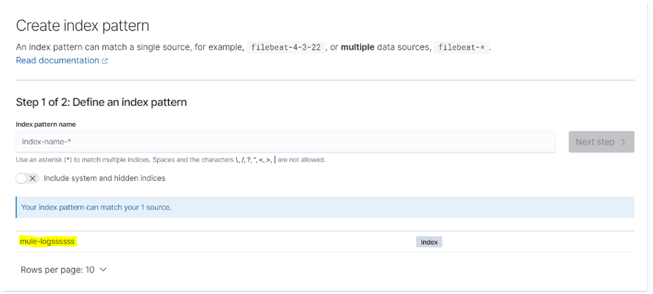
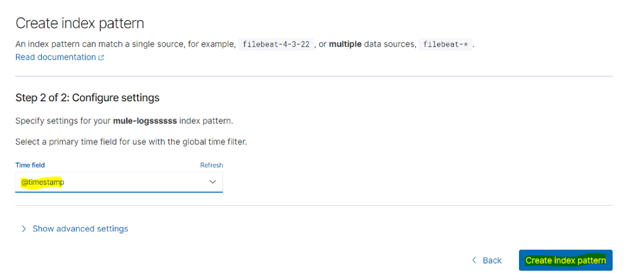
Our index pattern has been created which means we can now see the logs in Kibana UI. Go to the homepage of the UI and click on discover from the left panel under Kibana section.
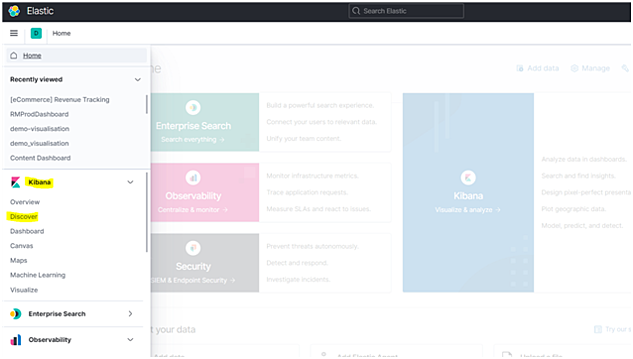
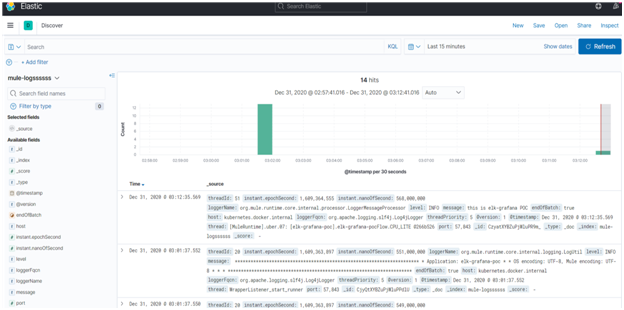
We can now completely see the logs in Kibana as shown below. From the left palette different filter operations and options can be chosen to aggregate the log data based on desired form. KQL (Kibana Query Language) can also be used to filter the data (not covered as part of this blog)
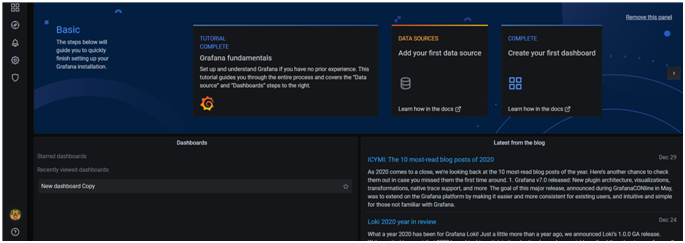
Let’s end the task with Grafana integration now. Unzip the grafana file that was downloaded earlier. Inside the bin folder open the grafana-server.exe file and then visit http://localhost:3000 to access the Grafana UI. By default the username and password is admin. (we have the provision to change it at a later stage)
In the left side go to settings and select Datasource (Datasource acts as the core system here to fetch the data from the desired source and to display in grafana). Click on add datasource in the next page and search for Elasticsearch. (since this is our source where the logs/data is stored)

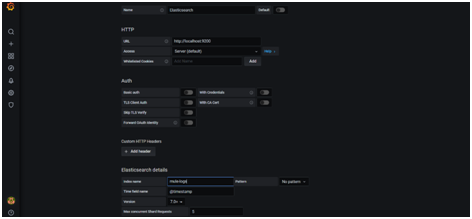
In the next page give the URL as http://localhost:9200, index name as mule-logs (as this is our index name in Kibana) and version to the latest version as given below in the snap and click save and test.
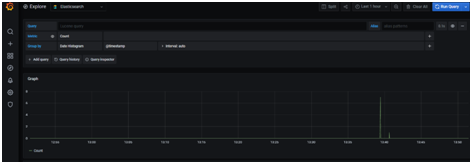
After this go to the homepage, and click on explore option from the left pallet, choose our data source from the drop down in the next window and we can see the graph chart with the live log movements as given below:
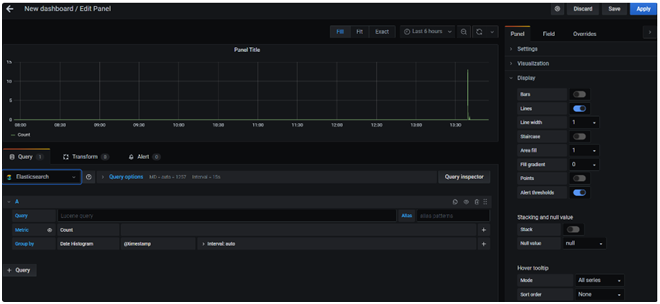
We can also create custom dashboards with Grafana. For that again visit the home page and click on Dashboard → Manage option from the left pallet. In the Next window click on New Dashboard and then click on Add new panel as given below:


In the next window select our data source from the drop down and click on save and apply by giving an appropriate name for the dashboard.

Conclusion
We can now see that our dashboard is all set with the log data movement. We can also customize and enrich the dashboard by adding extra fields, setting up alerts and configuring different representations of data like Pie-chart, histogram etc.
We have now successfully integrated ELK stack, Grafana and Studio Logs.
Note: As of now we have only covered Studio Logs synchronization with ELK and Grafana. This is mainly done with cloudhub logs in real as there are limitations for default cloudhub logging. The procedure to do that is also related to tweaking the log4j2 file. However to achieve this the default cloudhub logging has to disabled which is only available on request (from MuleSoft). (As an alternative cloudhub APIs can be used to fetch the logs on a continuous basis and logic can be implemented for achieving the equivalent functionality)